Access through R
If you want to experience the full functionality of our dataset we have a complementary R package gecko – geographical ecology and conservation knowledge online.
First, download and install gecko.
install.packages("gecko")gecko comes with a group of datasets ready to use for testing of its functions. Consider the dataset gecko.range, a raster file for the geographic range of the spider Hogna maderiana (Walckenaer, 1837).
library(gecko)
library(terra)

hogna = gecko_data("range")

plot(hogna)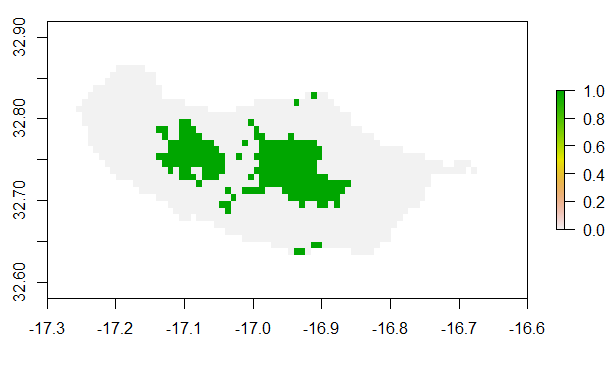
Now, say you suspect that Hogna maderiana is currently being threatened by habitat loss due to urban development. Maybe you are a researcher and like to run some spatial analyses to see if this could be the case. Check to see what SPECTRE threats might match your intent.
You can check which layers are available using
?spectre_citations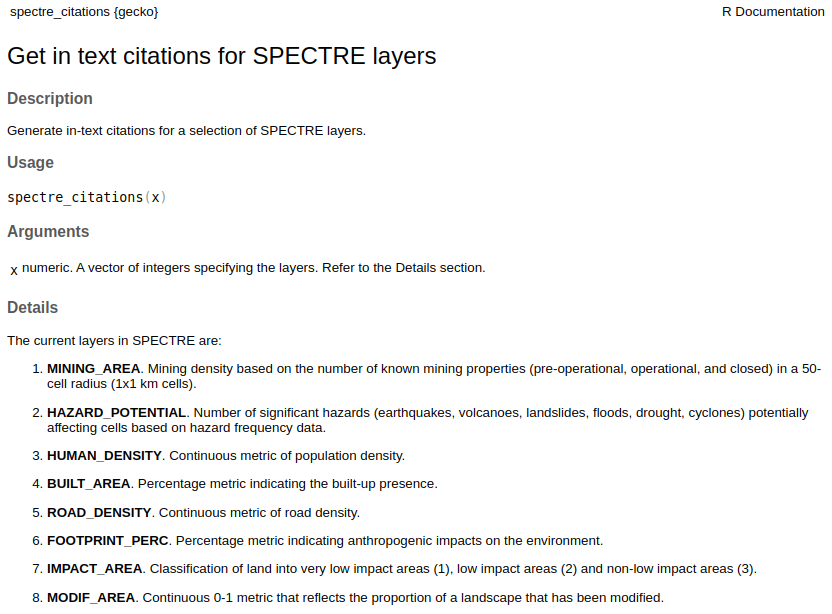
Some of these threats look interesting! We will explore this reduced set of layers in this example but we highly recommend that you check out the full description of all layers and how they were calculated in our paper.
For this tutorial let us focus on two threats: BUILT_AREA and ROAD_DENSITY.
We know that they are layers 4 and 5 from the list above and would like to crop them to the extent of the distribution map we are working with.
input_ext = ext(hogna)

my_threats = spectre_area(x = c(4,5), ext = input_ext, normalize = FALSE, filepath = NULL)

plot(rast(my_threats))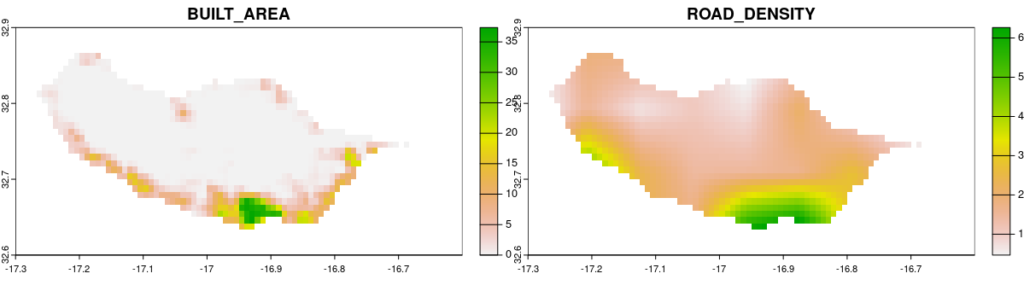
That is it! But maybe you would rather just have the data associated with a couple of points?
my_threats = spectre_points(x = c(4,5), points = my_points)

my_threats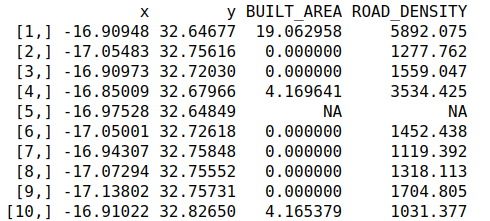
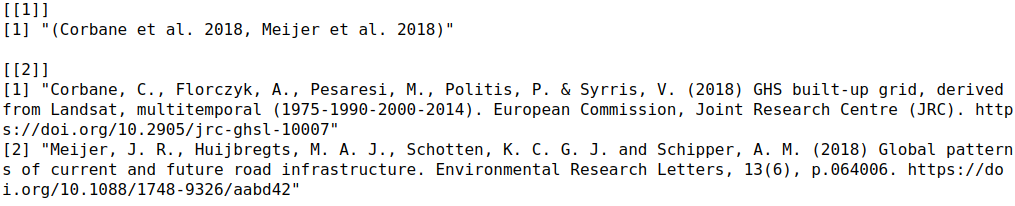
Finally, we can return to spectre.citations to easily get citations for the data we requested.
spectre.citations(selection)